Wednesday, July 7, 2021
You've been waiting for it, and now it's here: our new "Progression" feature for your horse is available on theSeaver app. After much thought and testing on the part of the team, we've come up with an accomplished, comprehensive and easy-to-read feature on the app. It will enable you to better monitor your horse's performance and health.
To access your horse's progress today, download the Seaver app or update it here. Finally, read on for full details of the feature. Happy reading!
The introduction of the new "Progression" feature has involved a new configuration of the app. When you log in to your account, you'll be taken to the page where all your workouts are listed, just as they were in the past. This is the navigation bar at the bottom of your screen that has changed. Browse it to discover your horses' profiles, launch a workout or ECG, our exercise catalog, or to access the drop-down menu on the left of your screen.
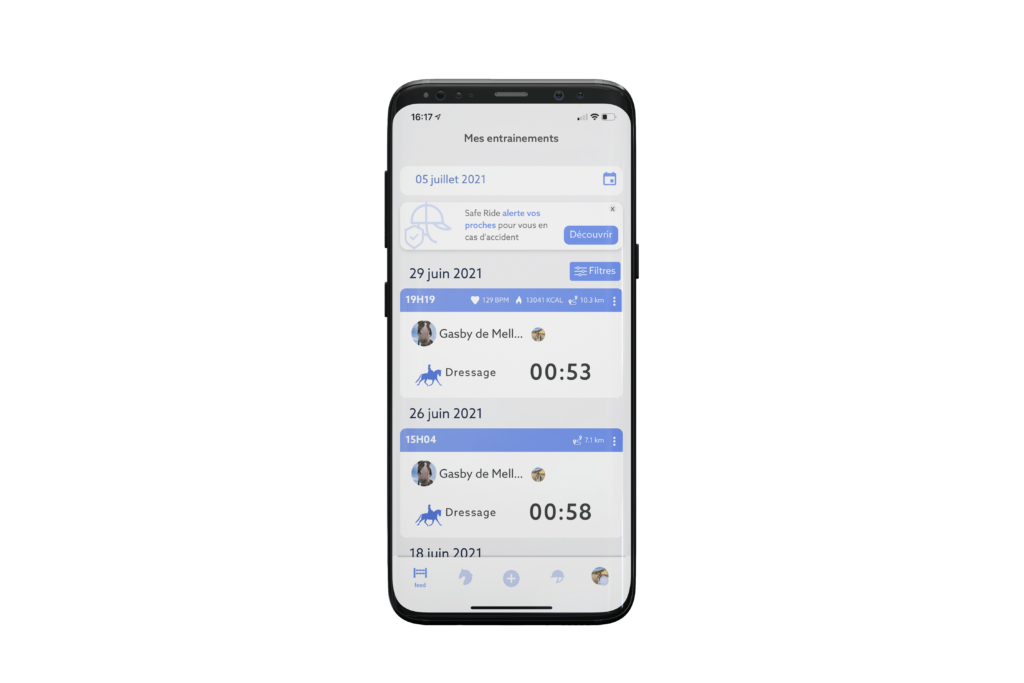
To access this design and functionality, you need to update the app via the usual stores.
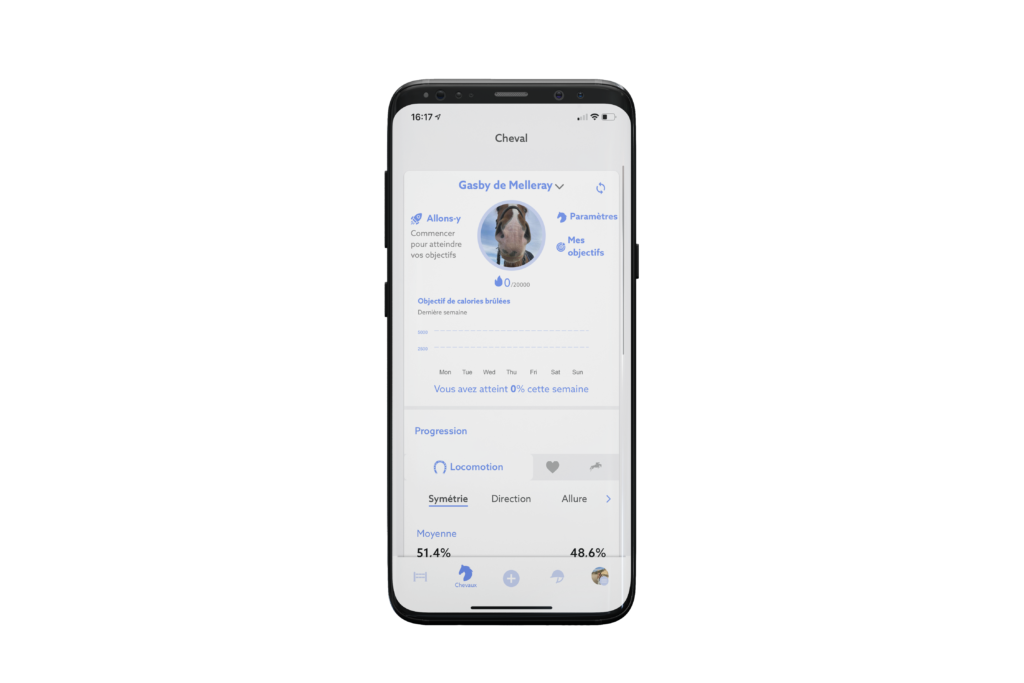
Finally, to see your horse's progress, click on the horse icon on the navigation bar. Your horse's progress is shown in his profileIt's as simple as that. It's easier and clearer!
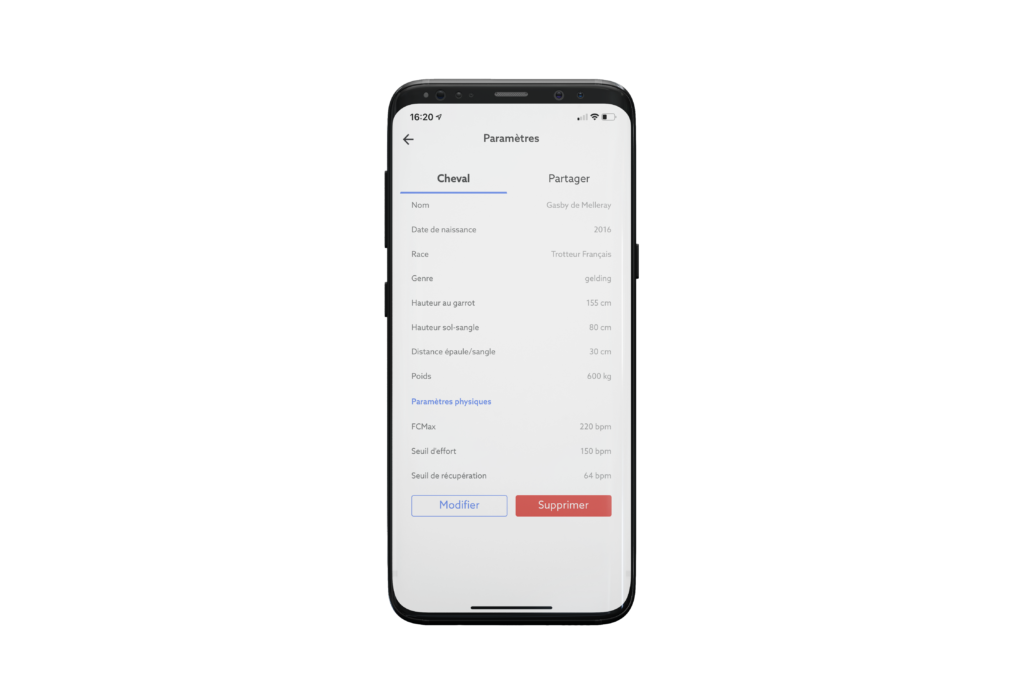
Welcome to your horse's new profile! Click on "Settings". As usual, you'll find all the information and physical parameters.
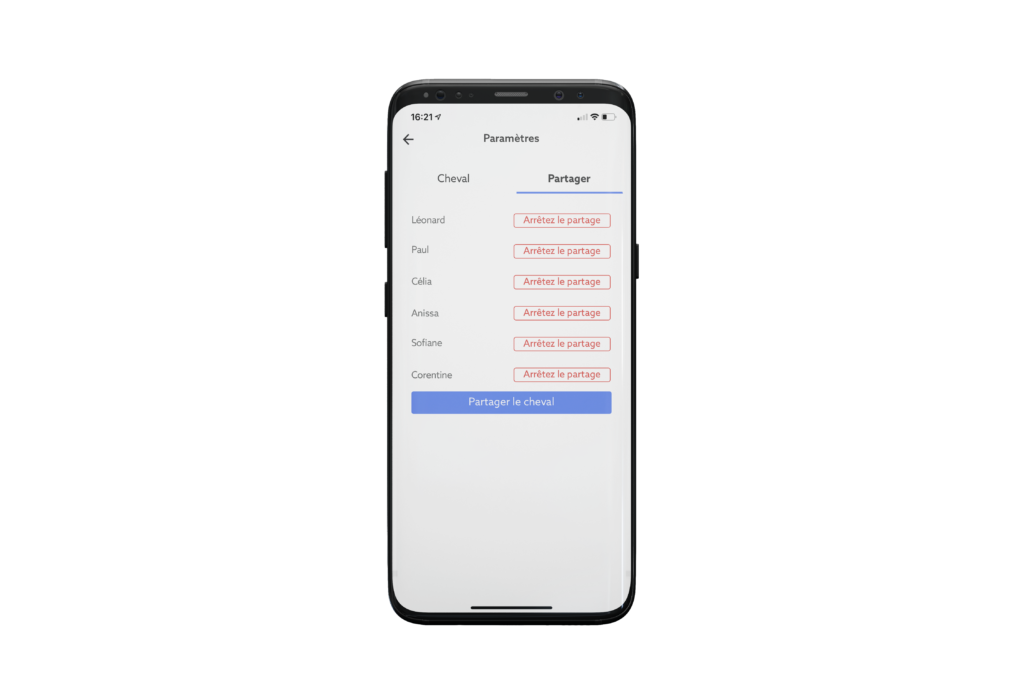
This is also where you can see with whom his profile is shared half-board, coach, veterinarian...
The first new feature here is that you can set a goal in terms of calories burned. You'll be able to follow it automatically for the current week.
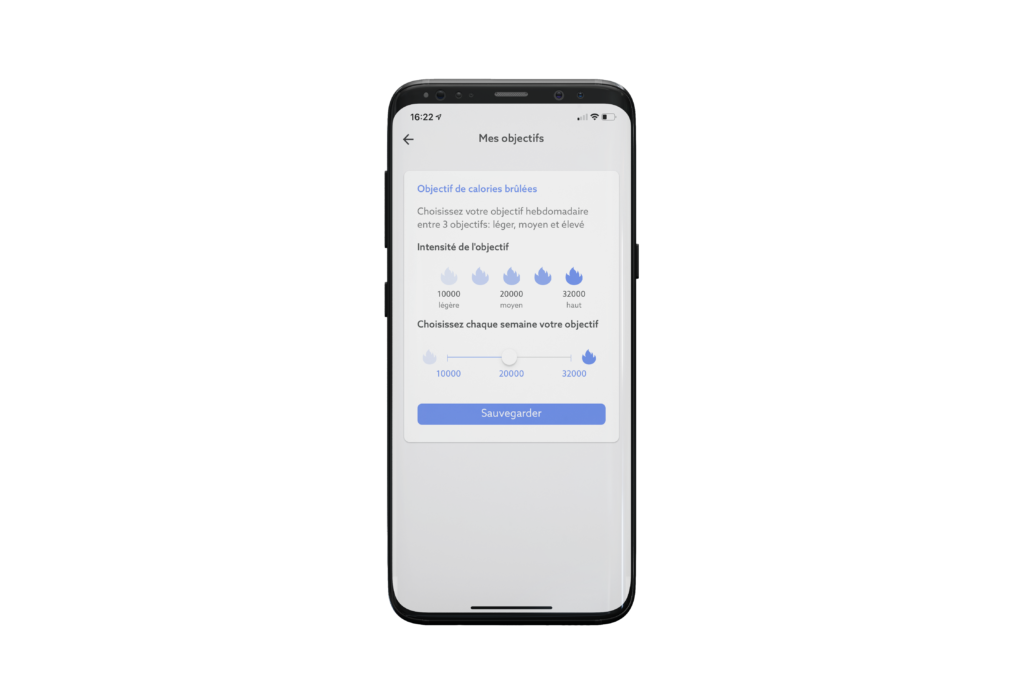
Choose your intensity from light, medium and high. The app will tell you where you stand during the week. This is very useful for know how hard you've worked over the course of a week and adjust if necessary.
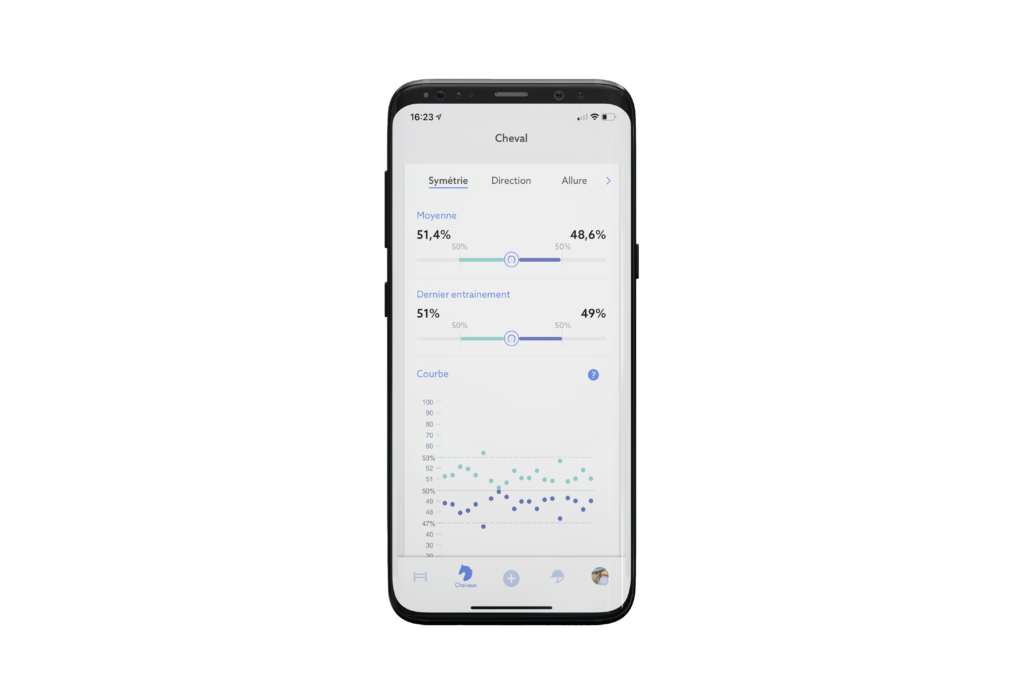
Scroll down your horse's page. You'll discover the evolution of locomotion parameters. Trot symmetry, right/left hand distribution, time spent at each gait, bounce and cadence.
Here you get the your horse's average trot symmetry over your last 20 sessions. Also shown is the symmetry of your most recent session. For even greater precision, the scatter plot not only shows you the trend in symmetry over your last 20 sessions, but also lets you know whether your horse is maintaining a symmetry (between 47 and 53%).
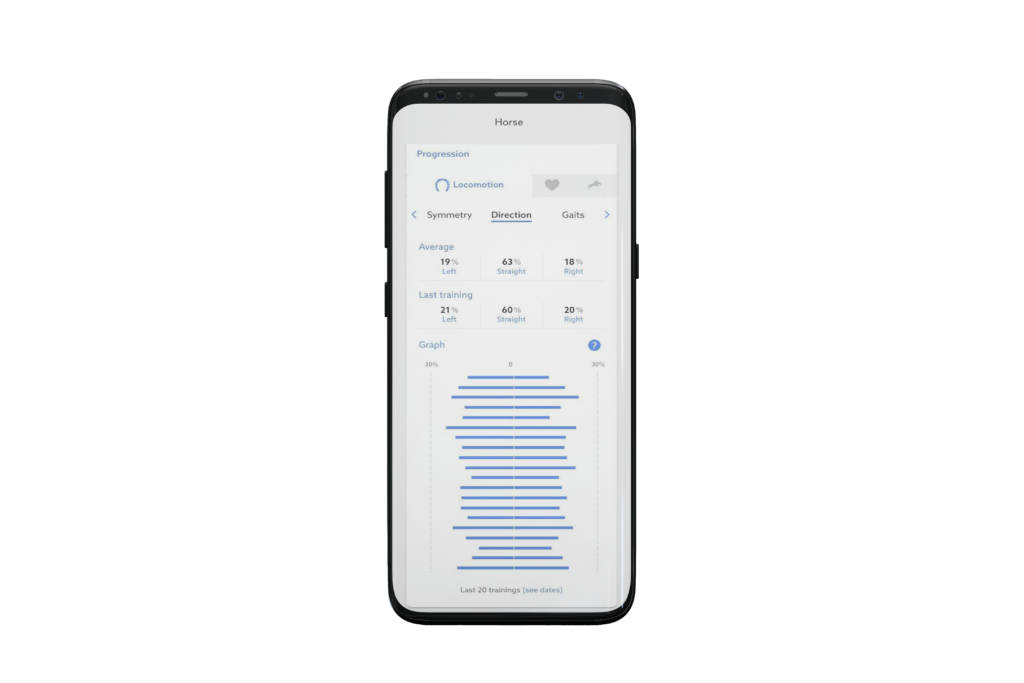
The direction tab shows you whether you've worked more left- or right-handed right or left hand. This gives you the average time spent on each hand over your last 20 sessions and the data for your last session. The bar graph summarizing the last 20 sessions, below, is ideal for finding out the trend of the hand that has been worked the most or, on the contrary, put aside.
It is essential tobalance work with both hands to avoid creating muscular tension on one side more than the other.
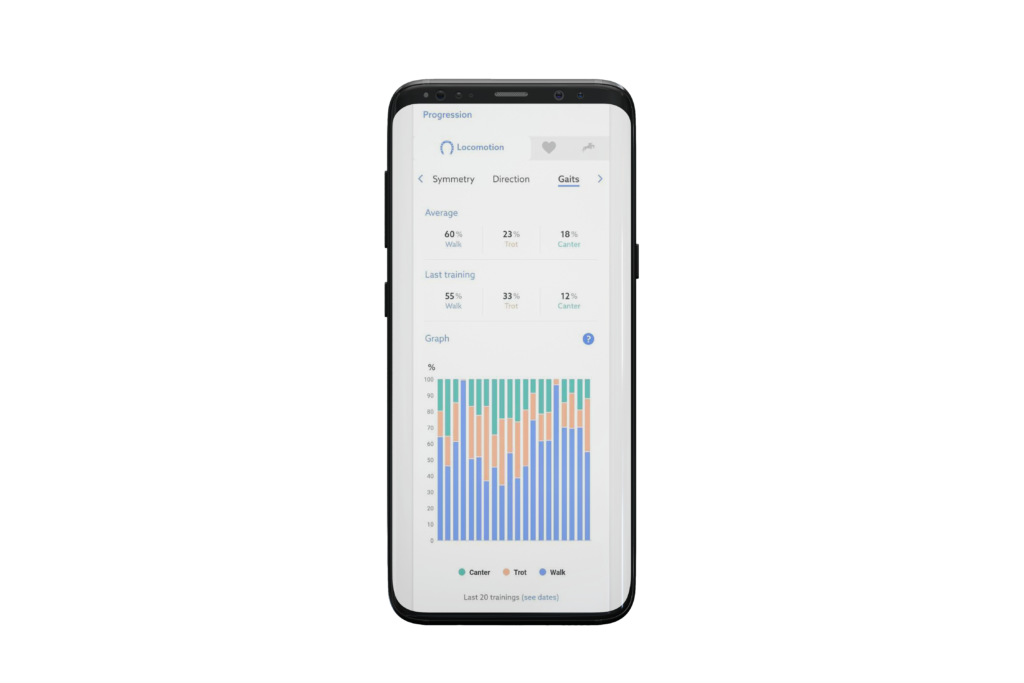
Have you ever noticed that we often spend a lot more time at a walk during show jumping sessions than during sessions on the flat? Well, this tab will help you come to that conclusion!
Following the same model, you will have the average time spent at each pace over your last 20 sessions and the data from your last session. The diagram shows you the percentage of work done at each pace over the last 20 workouts.
Find here the average rebound at each pace and the data from your last session.
By analysing your horse's bounce curve, you can see whether the quality of his has deteriorated or improved in recent training sessions. over the last few training sessions.
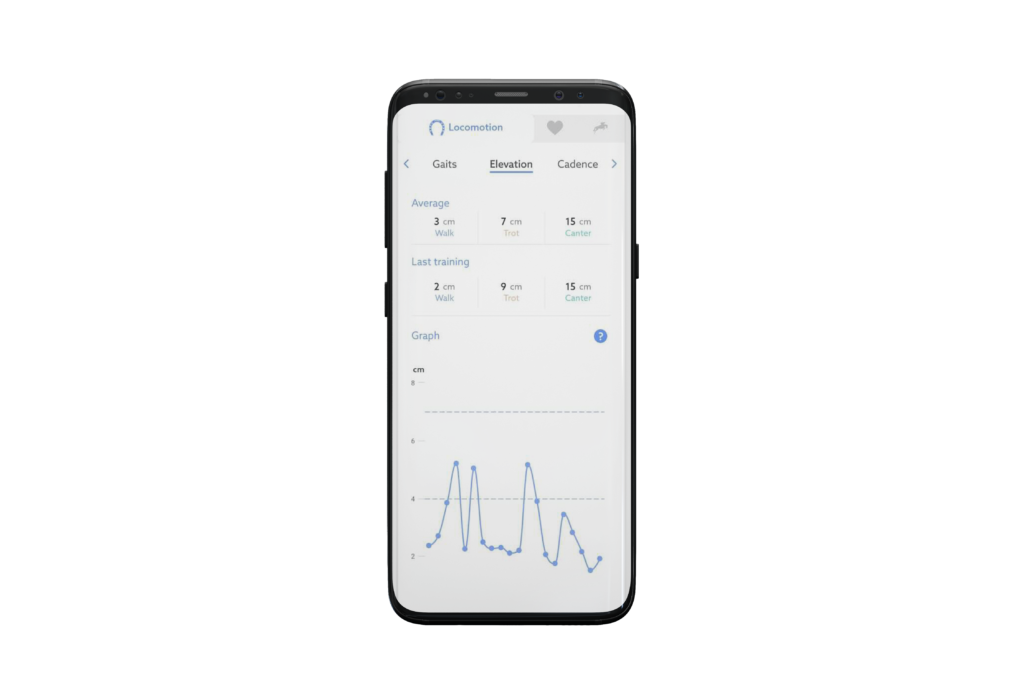
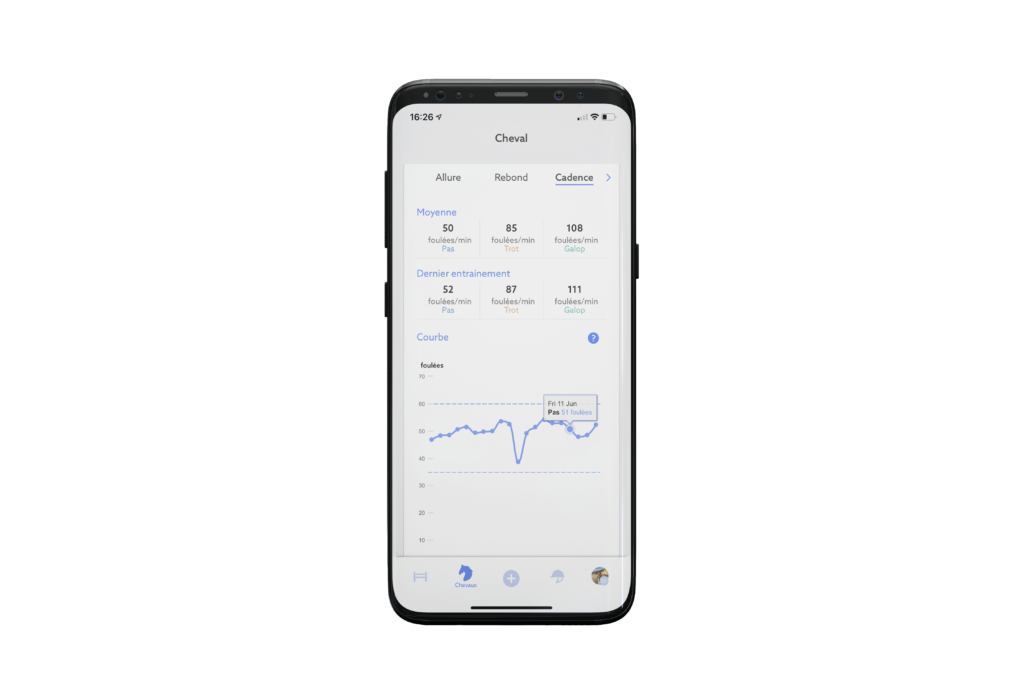
The last locomotion parameter to be scrutinized is cadence, or the number of number of strides per minute at each gait.. You have the average cadence at each gait for your last 20 sessions and the raw data for your most recent session.
The curve below allows you to follow the evolution of your horse's walk, trot and canter cadence and situate it within a range of normal cadence data.
Work on your lengthening in one session and observe whether your average cadence exceeds that of the other sessions. You can then evaluate the quality of your lunges, making sure your horse doesn't rush.
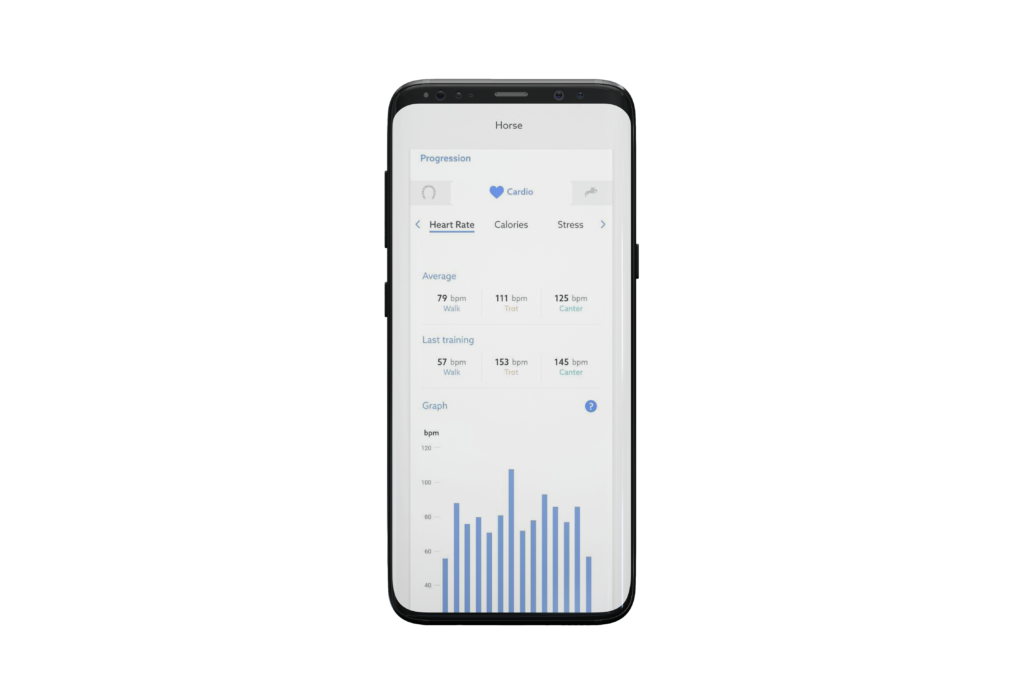
Want to know if your horse's your horse's heart rate is improving? ? Take a look at this tab, it may be able to help.
Read here the average heart rate of your last 20 sessions and the raw data of your last training session. The diagram shows your horse's heart rate in bpm over the last 20 training sessions. And this at every gait (raw and average values).
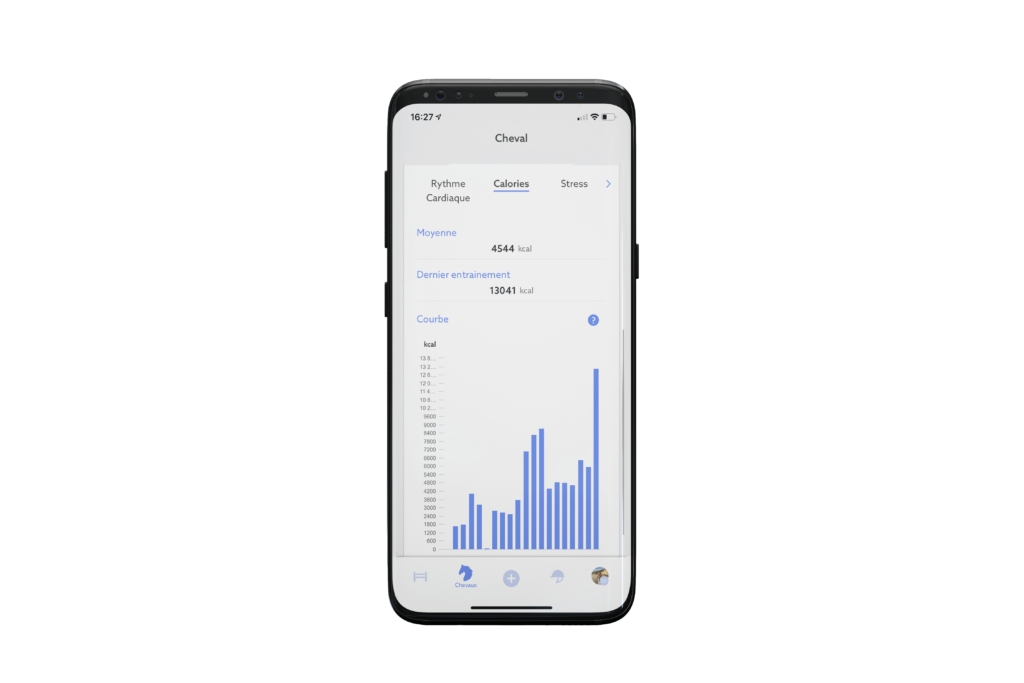
Same pattern: average number of calories burned in recent sessions and calories burned in your last workout. The diagram represents the number of calories burned over your previous 20 sessions.
Understand the evolution of calories burned by comparing them with your horse's physical condition. Use calories burned to get an overview of the intensity of the sessions
The start of the competition season is approaching and your horse has put on weight? Use this parameter to get him back into shape.
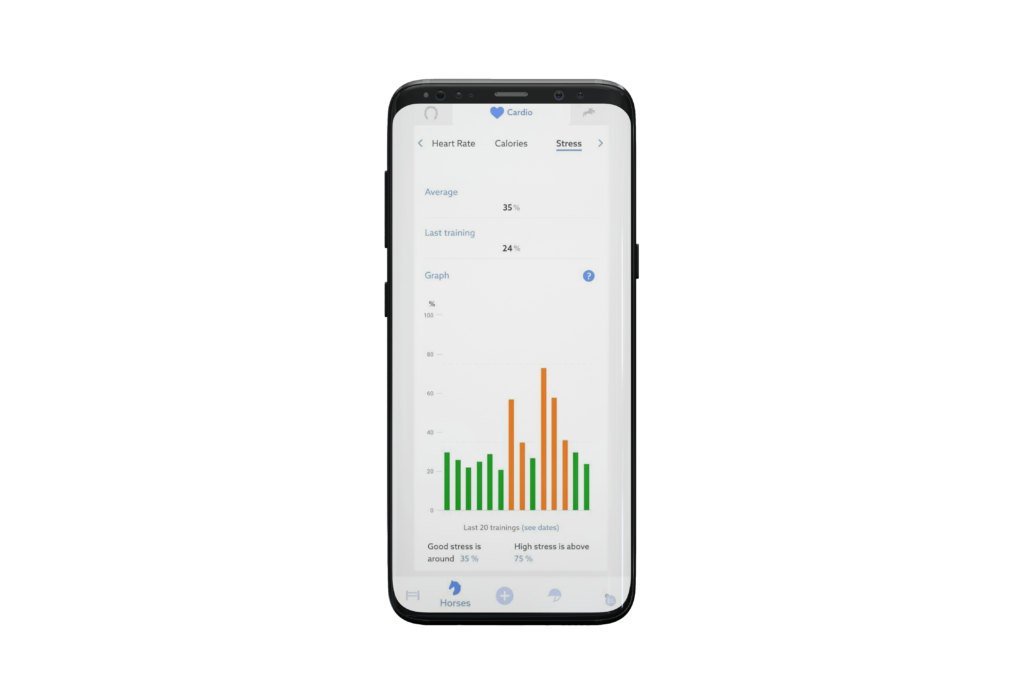
The stress tab gives you the percentage of stress calculated over your last 20 sessions and the last one. The diagram shows the evolution of this parameter over the last 20 sessions, distinguishing between low, medium and high stress.
Use this chart to bring serenity serenity your horse for the long term.
On average, how long does it take my horse to recover recover from his exertions ? How long did it take my horse to recover from his effort during my last training session? Use this tab to find out.
The diagram also allows you to determine your horse's your horse's recovery time during your last 20 sessions.
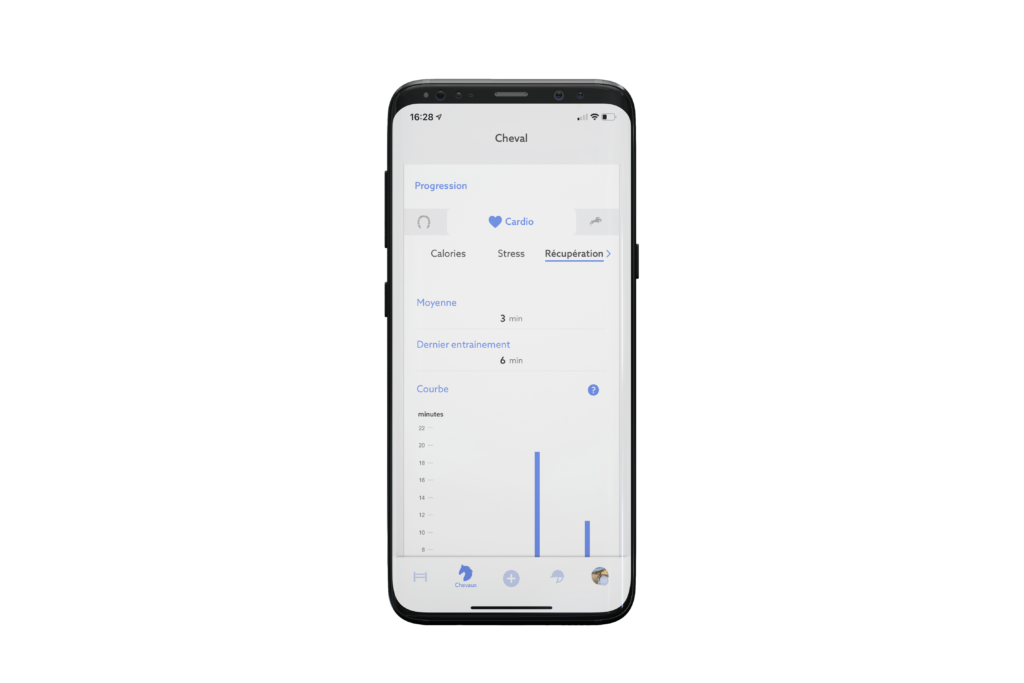
Optimize youryour horse's physiological efficiency and watch it improve!
In the "Jumping" tab, you can first access the average number of average number of jumps per month. In addition, you can see the number of jumps performed last month. The graph below summarizes the number of jumps over the 12 months of the year.
Then, in the "Offset" section, you have access to the average number of jumps made per month, the number of right jumps and the number of jumps made with a left or right offset. number of straight jumps and the number of jumps made with a left or right offset. Same for last month.
The curve below shows a monthly comparison between the number of jumps made with an offset and those made straight.
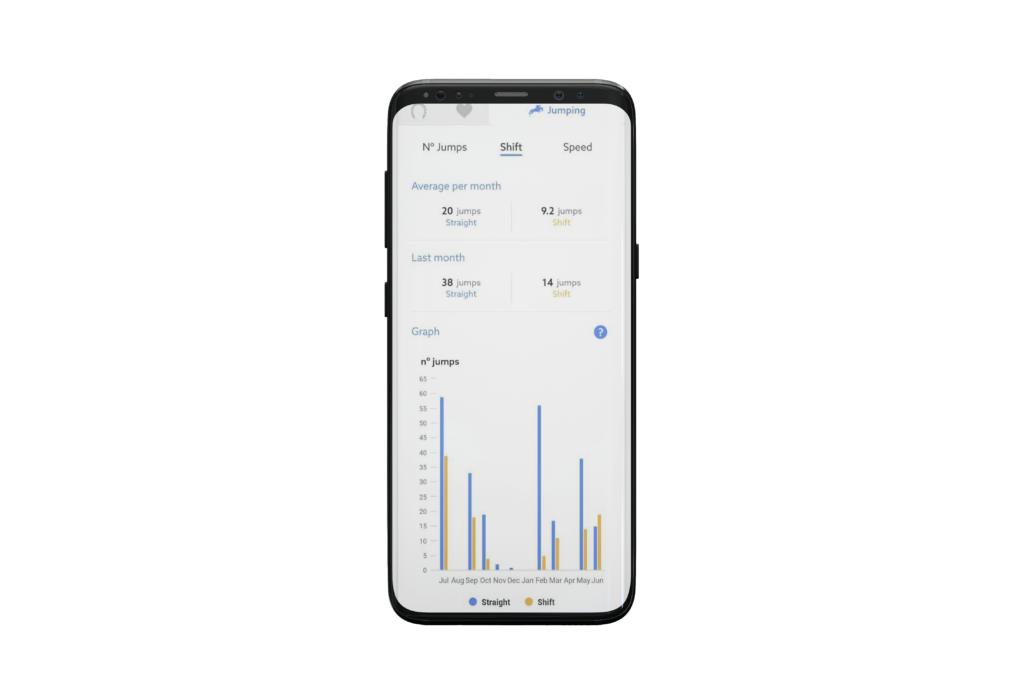
Work on straightness at the jumps and maximize your chances of a clear round.. With precise data on the last 20 sessions, you'll be able to see the real improvement in your approach.
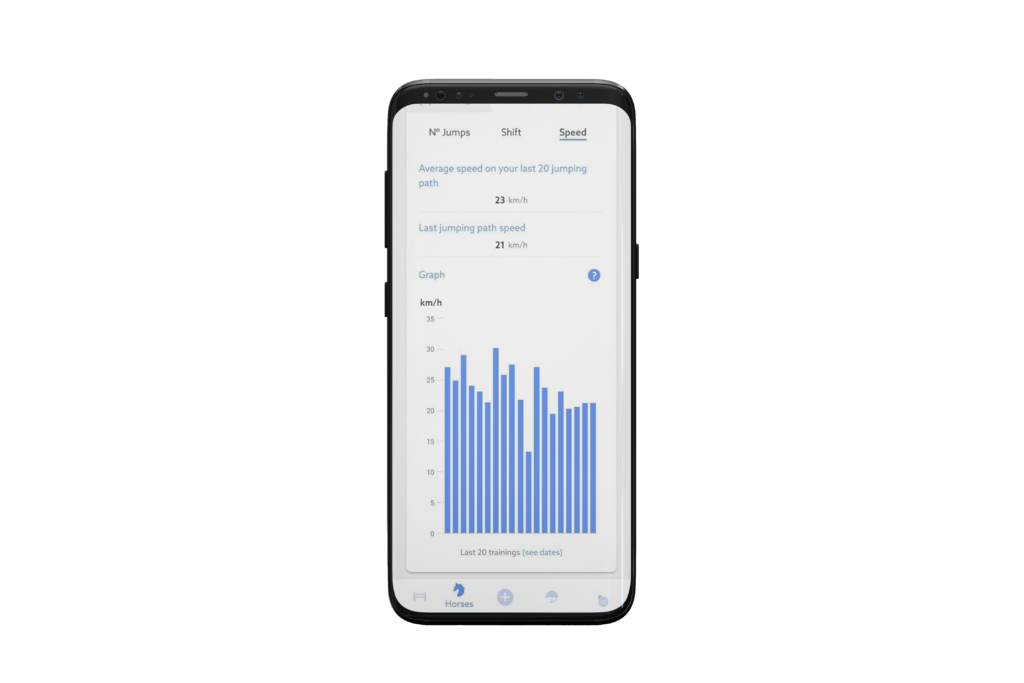
Finally, the "speed" section tells you more about the rhythm rhythm you have on your show jumping courses. You'll find the average speed over your last 20 courses, the speed of your the speed of the last course and the gross speed of the courses of your last 20 training sessions.
Depending on our sporting objectives, we look for different things in our horses. For know if your horse is evolving in the right direction and if your work is bearing fruityou'll find the Progression feature extremely useful.
You can then compare your sessions with each other to analyze what you did better or worse. You can then better understand the direct effects of each of your workouts. This gives you areas for improvement for your work, and therefore for your horse's performance.
The limbs are very sensitive. They are therefore all likely to experience lameness in the course of their lives. Whether you're a sport or leisure horse, it's vital to prevent lameness as far as possible, and find the cause before it occurs.
The Progression feature allows you to notice any deterioration in your horse's gaits and thus anticipate the onset of lameness. Once this analysis has been made, all you have to do is contact the horse health specialist who is most likely to find the cause of the lameness. The most common causes of lameness are limb, tooth or back problems.
On the other hand, if your horse is recovering from an injury and is facing a rehabilitation periodProgression can also be useful. For example, to keep a close eye on the evolution of working time at each gait. Or to check that your horse's condition is not deteriorating again. Finally, it also allows you to see starting point in rehabilitation and its end point at the end of rehabilitation..
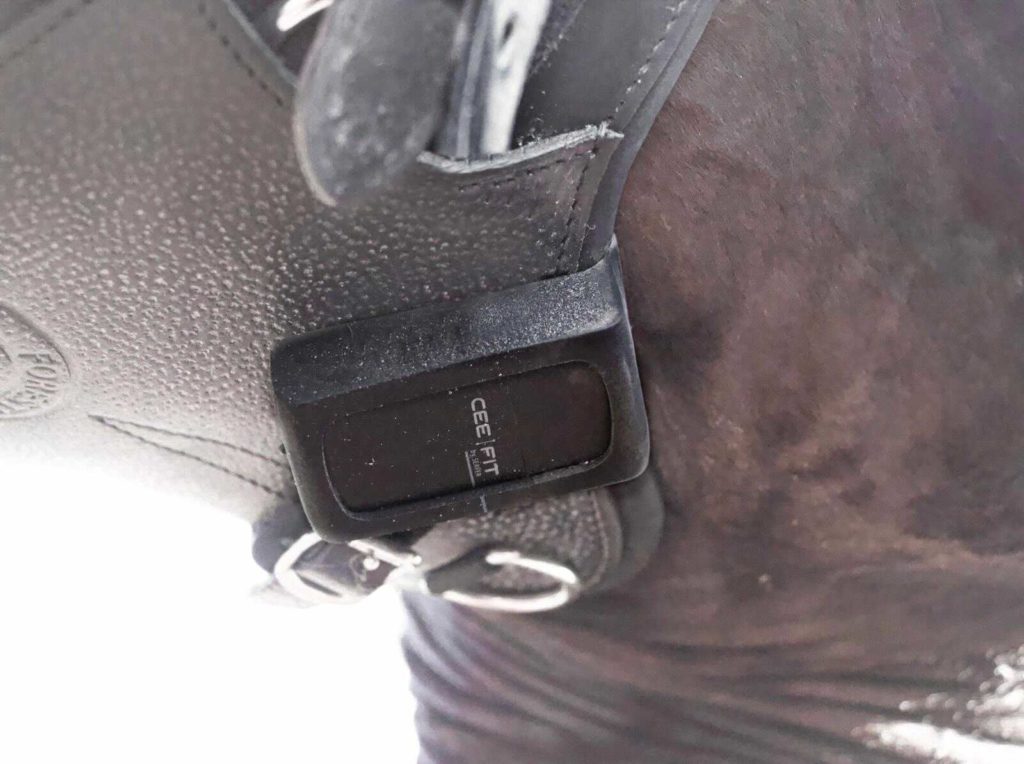
To access the Progress feature, you must first collect data. And to collect this data, you need to have a CEEFIT or a CEEFIT and CEEFIT Pulse + ECG package. These tools will be a great help in monitoring your horse's progress on all the points we have raised above.
Last but not least, the new Progression feature of the Seaver application will enable you to clearly see the evolution of more than a dozen of your horse's locomotion, cardio and jumping parameters.
This gives you a better idea of your horse's development over time, the quality of your work and its state of health over the course of the year.
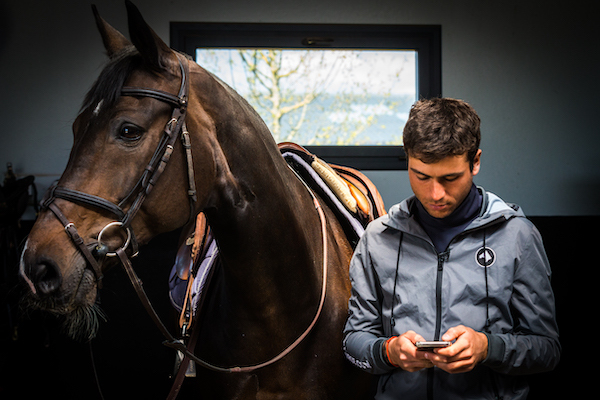
To find out more about how Progression can help you track your horses' health and performance, we're preparing an article in collaboration with professional rider Benjamin Stoutwho will share his experience of how Progression enabled him toanticipate his horse's lameness.
-The Seaver team